create your own plausible analytics ios widget
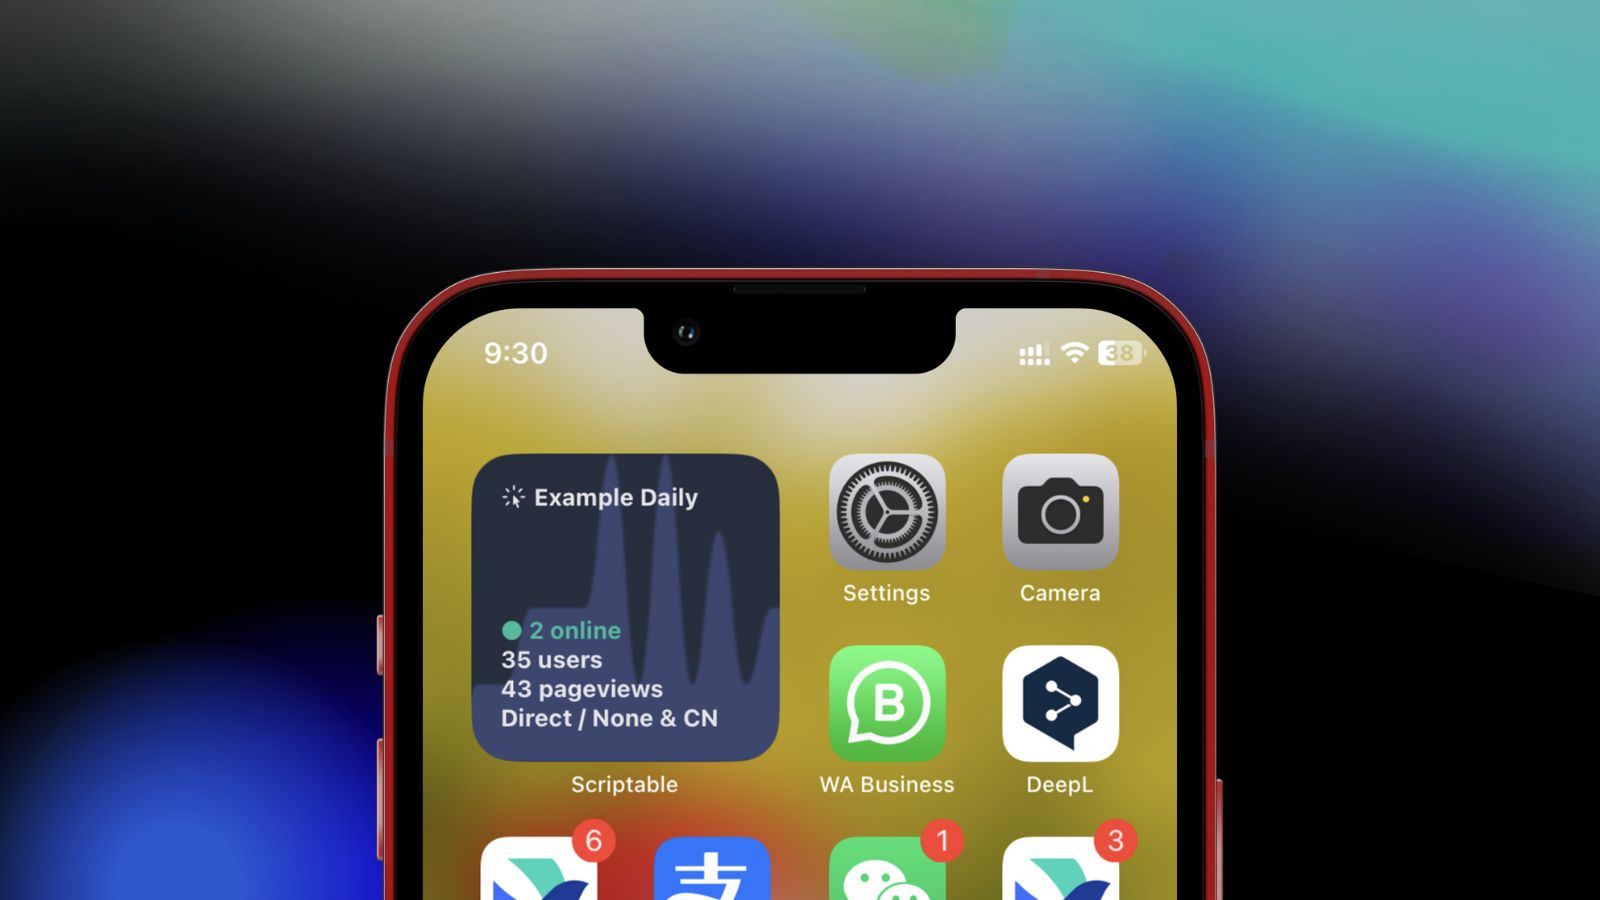
Here’s a script to create your own Plausible Analytics iOS widget. With this 1:1 block widget, you can access key daily metrics directly from your iPhone or iPad’s Home Screen, such as real-time data, page views, unique visitors, top referrer, and top country. See set-up instructions below. Applicable to self-hosted instances.
The script:
// Scriptable iOS widget for self-hosted Plausible instances
// By mgx.me. Inspired by @linuz90 Fabrizio Rinaldi
// Change date filters according to your preferences

// replace analytics.example.com with your baseURL where plausible is hosted
let baseURL = 'https://analytics.example.com/api/v1/stats/'

// Replace PlausibleToken with your API Key
let head = {"Authorization":"Bearer verynicetoken"}

// Replace example.com with your siteID, i.e, domain.tld
let siteID = 'example.com'

// Get the data to draw chart based on daily metrics
const url = baseURL + 'timeseries?site_id=' + siteID + '&period=day'
let req = await new Request(url)
req.headers = head
var result = await req.loadJSON()

// Get realtime visitor metrics
const url2 = baseURL + 'realtime/visitors?site_id=' + siteID
let req2 = await new Request(url2)
req2.headers = head
const liveVisitors = await req2.loadString()
var copy1 = '● ' + await req2.loadString() + ' online'

// Get daily active users and pageviews
const url3 = baseURL + 'aggregate?site_id=' + siteID + '&period=day&metrics=visitors,pageviews'
let req3 = await new Request(url3)
req3.headers = head
var result2 = await req3.loadJSON()

// Top traffic source today
const url4 = baseURL + 'breakdown?site_id=' + siteID + '&period=day&property=visit:source&limit=1'
let req4 = await new Request(url4)
req4.headers = head
var result3 = await req4.loadJSON()

// Top country source today
const url5 = baseURL + 'breakdown?site_id=' + siteID + '&period=day&property=visit:country&metrics=visitors&limit=1'
let req5 = await new Request(url5)
req5.headers = head
var result4 = await req5.loadJSON()

// LineChart
class LineChart {
  // LineChart by https://kevinkub.de/

  constructor(width, height, values) {
    this.ctx = new DrawContext();
    this.ctx.size = new Size(width, height);
    this.values = values;
  }

  _calculatePath() {
    let maxValue = Math.max(...this.values);
    let minValue = Math.min(...this.values);
    let difference = maxValue - minValue;
    let count = this.values.length;
    let step = this.ctx.size.width / (count - 1);
    let points = this.values.map((current, index, all) => {
        let x = step*index;
        let y = this.ctx.size.height - (current - minValue) / difference * this.ctx.size.height;
        return new Point(x, y);
    });
    return this._getSmoothPath(points);
  }

  _getSmoothPath(points) {
    let path = new Path();
    path.move(new Point(0, this.ctx.size.height));
    path.addLine(points[0]);
    for(let i = 0; i < points.length-1; i++) {
      let xAvg = (points[i].x + points[i+1].x) / 2;
      let yAvg = (points[i].y + points[i+1].y) / 2;
      let avg = new Point(xAvg, yAvg);
      let cp1 = new Point((xAvg + points[i].x) / 2, points[i].y);
      let next = new Point(points[i+1].x, points[i+1].y);
      let cp2 = new Point((xAvg + points[i+1].x) / 2, points[i+1].y);
      path.addQuadCurve(avg, cp1);
      path.addQuadCurve(next, cp2);
    }
    path.addLine(new Point(this.ctx.size.width, this.ctx.size.height));
    path.closeSubpath();
    return path;
  }

  configure(fn) {
    let path = this._calculatePath();
    if(fn) {
      fn(this.ctx, path);
    } else {
      this.ctx.addPath(path);
      this.ctx.fillPath(path);
    }
    return this.ctx;
  }

}

// Widget for iOS
let widget = new ListWidget()
widget.backgroundColor = new Color("#252F3F")
const txtColor = new Color("#E5E7EB")
const onlineColor = new Color("#1abc9c")

// Stack icon and brand name (get SF Symbols or use an image)
let sym = SFSymbol.named("cursor.rays")
let brandStack = widget.addStack()
let icon = brandStack.addImage(sym.image)
icon.tintColor = txtColor
icon.imageSize = new Size(15, 15)
let textStack = brandStack.addStack()
let domain = textStack.addText(' Example Daily')
domain.textColor = txtColor
domain.font = Font.boldSystemFont(13);
brandStack.layoutHorizontally()

// Webs page to visit when you tap on the widget
widget.url = 'https://analytics.example.com'

// Get data to draw chart
const d1 = result.results[0].visitors
const d2 = result.results[1].visitors
const d3 = result.results[2].visitors
const d4 = result.results[3].visitors
const d5 = result.results[4].visitors
const d6 = result.results[5].visitors
const d7 = result.results[6].visitors
const d8 = result.results[7].visitors
const d9 = result.results[8].visitors
const d10 = result.results[9].visitors
const d11 = result.results[10].visitors
const d12 = result.results[11].visitors
const d13 = result.results[12].visitors
const d14 = result.results[13].visitors
const d15 = result.results[14].visitors
const d16 = result.results[15].visitors
const d17 = result.results[16].visitors
const d18 = result.results[17].visitors
const d19 = result.results[18].visitors
const d20 = result.results[19].visitors
const d21 = result.results[20].visitors
const d22 = result.results[21].visitors
const d23 = result.results[22].visitors
const d24 = result.results[23].visitors
let data = [d1, d2, d3, d4, d5, d6, d7, d8, d9, d10, d11, d12, d13, d14, d15, d16, d17, d18, d19, d20, d21, d22, d23, d24];
let chart = new LineChart(400, 200, data).configure((ctx, path) => {
  ctx.opaque = false;
  ctx.setFillColor(new Color("6574CD", .35));
  ctx.addPath(path);
  ctx.fillPath(path);
}).getImage();

widget.addSpacer()

// Set chart as background
widget.backgroundImage = chart

// Display active users
if (liveVisitors == '0'){
t2 = widget.addText("● 0 online" )
t2.font = Font.boldSystemFont(13)
t2.textColor  = Color.gray()
}
else {
t2 = widget.addText(copy1)
t2.font = Font.boldSystemFont(13)
t2.textColor  = onlineColor
}

// Set DAU, top sources, and top country
if (result2.results.visitors.value == '0'){
tr = widget.addText("no data yet." )
tr.font = Font.boldSystemFont(13)
tr.textColor  = Color.gray()
}
else {
const visitors2 = (result2.results.visitors.value)
const views = (result2.results.pageviews.value)
const sources = (result3.results[0].source)
const geo = (result4.results[0].country)
tr = widget.addText(visitors2  + " users")
tr.font = Font.boldSystemFont(13)
tr.textColor  = txtColor
pv = widget.addText(views  + " pageviews")
pv.font = Font.boldSystemFont(13);
pv.textColor  = txtColor
tc = widget.addText(sources + " & " + geo)
tc.font = Font.boldSystemFont(13);
tc.textColor  = txtColor
}

// Wrap up and set widget size
Script.setWidget(widget)
if (!config.runsInWidget) {
  await widget.presentSmall()
}
Script.complete()
Note:
- example.com = your primary domain, and analytics.example.com = the subdomain where you’ve installed Plausible. You’ve to replace both accordingly.
- The widget size is 1×1. That’s a small, square size widget.
- It is only tested on self-hosted Plausible instances.
How to create the iOS widget:
Step 1: Generate an API key from https://analytics.example.com/settings.
Step 2: Install Scriptable on your iPhone/iPad.
Step 3: Get plausible.js.
Step 4: Edit the script.
- line 6, add your baseURL, eg: https://analytics.example.com/api/v1/stats/.
- line 9, add your API key.
- line 12, add your siteID, which is example.com.
- line 114, replace “Example Daily” with your brand or domain name.
- line 120, add a URL to visit after tapping the widget.
Step 5: Save the script and set your widget.